Blog
Racial disparity in exclusions: what can data tell us?
Why it’s important that we reduce school exclusions
At the Youth Endowment Fund (YEF), we know that to achieve our mission to prevent children getting involved in violence, we need to find out what works to improve attendance at school and reduce exclusions. We can see the link between violence and exclusions in the data – recent analysis by the Department for Education (DfE) and Ministry of Justice (MoJ) shows that, of children that commit a seriously violent offence, 85% were persistently absent and 15% were permanently excluded.
Being away from school not only limits a child’s ability to succeed academically, but puts them at risk of criminal exploitation or being trapped in dangerous home environments. That’s why, together with our partners at the Education Endowment Foundation (EEF), we’re investing millions of pounds in our grant rounds, A safe, positive place to learn and School choices (which closes tomorrow). By funding programmes and investigating the impact of different school policies, we’ll build a picture of how we can keep young people safe by making sure they’re in school.
It’s also important that we recognise that exclusions haven’t affected all young people equally. There’s been a consistent pattern in English exclusion rates, where children from some ethnic minority backgrounds (including Black Caribbean and Gypsy, Roma or Traveller children) have been significantly more likely to be excluded than their White classmates. This has been highlighted as a concern by Edward Timpson in his review of school exclusion and by former Children’s Commissioner Anne Longfield. Persistent overrepresentation of Black young people is clearly a problem – and one that we urgently need to address.
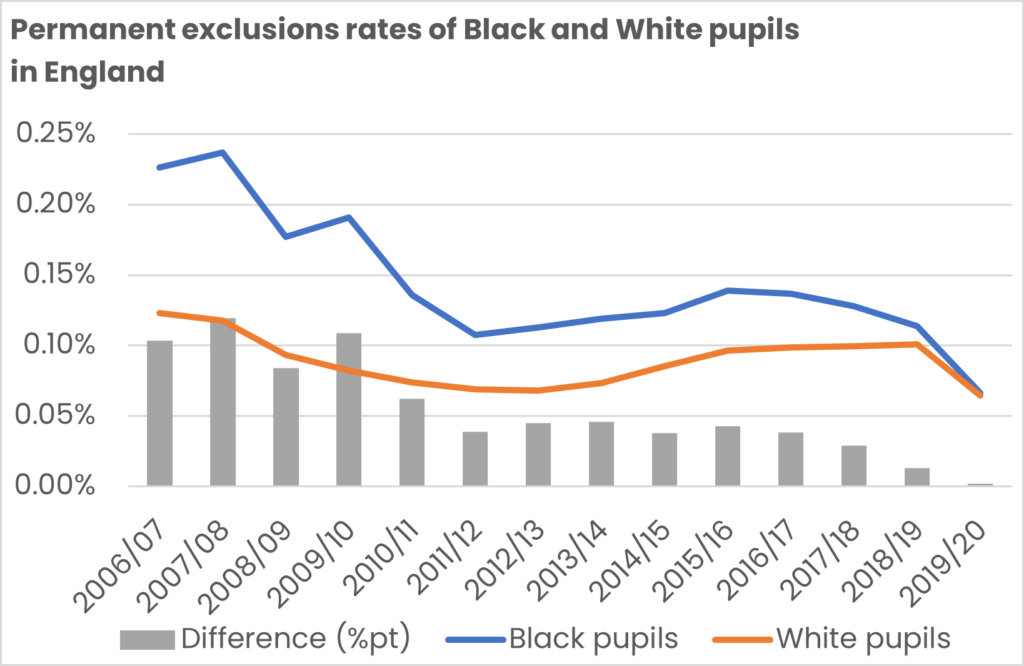
To do that, we need to understand what’s happening. And latest data from the Department for Education (DfE) does give us some cause to think that things might be improving, with the gap between Black and White pupils virtually disappearing in 2019/20 (a year heavily affected by COVID-19-related school closures). At the moment, we don’t know why this is. But by digging into the data, we can learn a little more about how things are different across the country and how exclusion rates vary between young people from different Black backgrounds.
What does the data tell us?
We’ve looked at the most recent figures from the DfE, which show how the gap in permanent exclusions between Black and White pupils has been narrowing over time. There were big drops in the late 2000s, and the gap’s been getting smaller since 2015. In 2019/20, when schools were experiencing closures during national lockdowns, the exclusion rate between Black and White pupils was almost the same.
So what’s driving this change?
There are lots of reasons that the gap in exclusion rates between Black and White pupils could be narrowing. It could be related to changes in the way schools deal with issues of race and racism, or differences in national policy or inspection. It could also be related to the pandemic in ways we don’t yet understand. Because we’ve only been able to use data available to us from the DfE, we haven’t been able to explore all of these possibilities. However, we have been able to pose ourselves two questions:
Could it be because of changing demographics?
We thought that one reason for the closing gap in permanent exclusion rates could be because of changing demographics in England’s schools.
As the graph below shows, pupils from Black African backgrounds have historically experienced lower exclusion rates than children from Black Caribbean backgrounds.
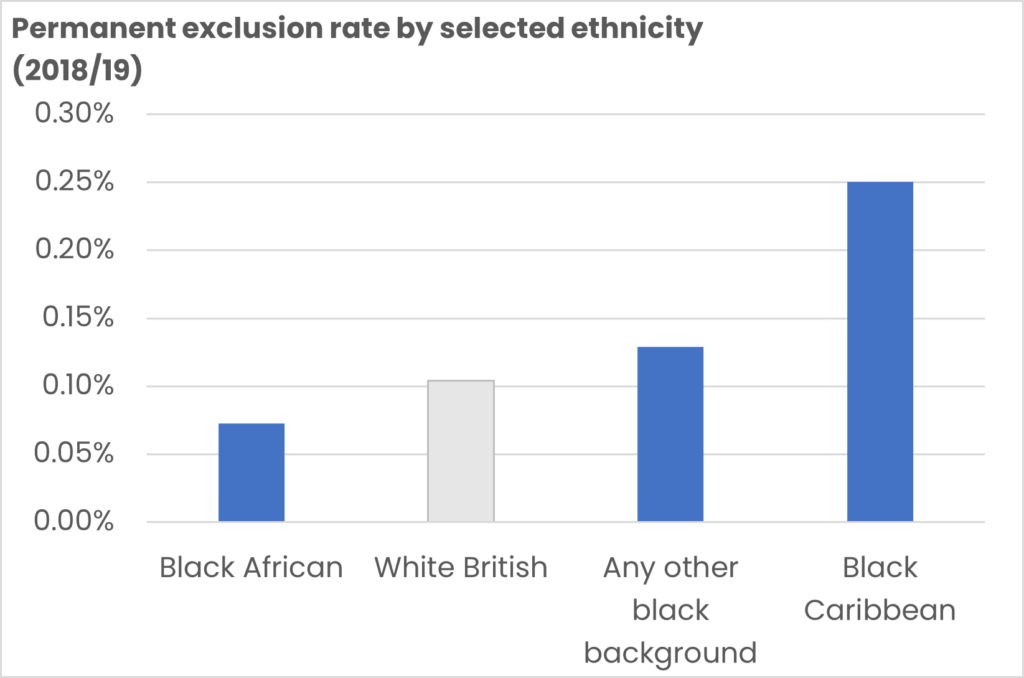
*In this analysis we’ve tended to focus on 2018/19, rather than 2019/20, due to the uncertain affects Covid restrictions and remote schooling had on the pattern of permanent exclusions.
Over time, the proportion of Black children in England’s schools from Black African or other Black backgrounds has been increasing, while the proportion from Black Caribbean backgrounds has been falling.
| 2006/07 | 2013/14 | 2019/20 | |
| Black African | 56% | 64% | 68% |
| Black Caribbean | 33% | 24% | 18% |
| Any other Black background | 11% | 12% | 14% |
But that fact that the proportion of Black African pupils is growing among the Black pupil population doesn’t mean we can assume this is the main reason for the narrowing rate of permanent exclusions between White and Black pupils.
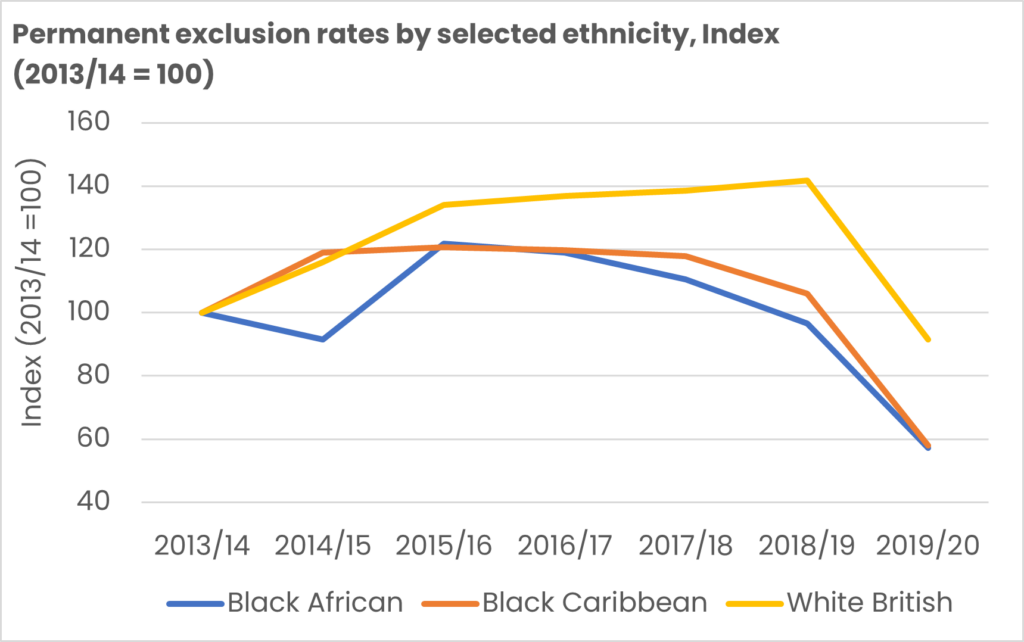
To test this, we made the assumption that the proportion of young people from Black African, Black Caribbean and other Black backgrounds was the same in all future years as it was in 2013/14. In the chart below, the blue line shows what actually happened and the orange line what would have happened if the share of pupils from Black Caribbean backgrounds hadn’t fallen.
The gap between the two lines shows that changes in demographics did play some part in how quickly the difference in permanent exclusions narrowed. However, the trend in the lines are very similar. And the lines also show that the exclusion rate gap would have fallen to virtually zero, regardless demographic changes. This means that, even though there is a small link between demographics and a narrowing exclusion gap, it isn’t a big driver.
Could it be because schools in places where there are higher numbers of Black pupils have reduced their use of exclusion rates by the largest amount?
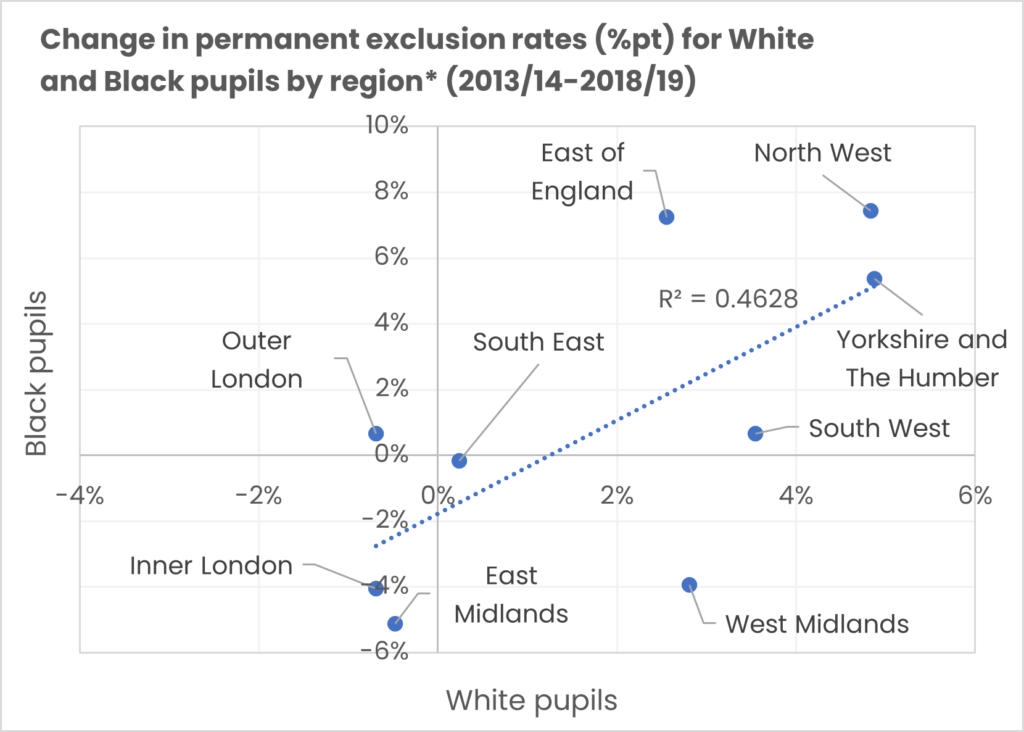
We also looked into regional differences. We thought that the change could be because schools in the places where there are the highest number of Black children (like London or the West Midlands) reduced their use of permanent exclusions, for White and Black children, by the largest amount.
Our analysis shows that we were right to think that when the use of exclusion falls, it falls for pupils from both Black and White backgrounds. For example, Inner London and the East Midlands have seen significant falls in the use of permanent exclusion rates for both Black and White pupils between 2013/14 and 2018/19. And in the North West, East of England and Yorkshire and the Humber, there were large increases in the use of permanent exclusions for Black and White pupils.
*The North East is excluded due to the small historic numbers of permanent exclusions amongst Black pupils.
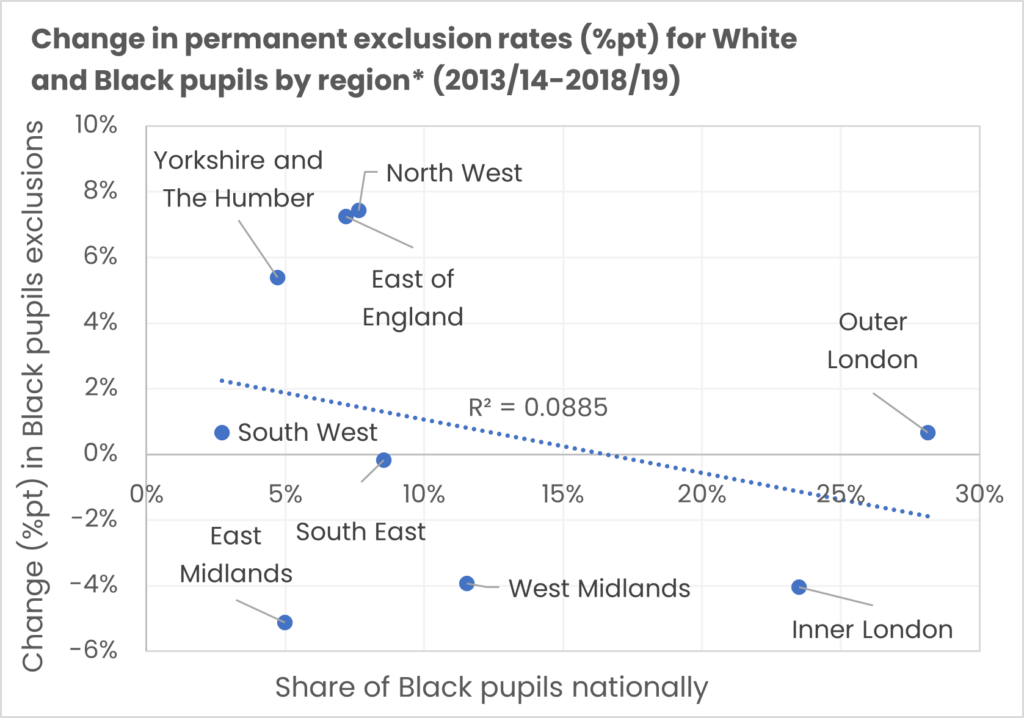
To test this further, we looked at whether permanent exclusion rates fell fastest in the areas where there are more Black students. This is shown in the chart below, where we plot the proportion of Black pupils within each region as a share of the national population against the regional change in Black pupils’ exclusion rates. The chart shows there is a very small correlation. In Inner London for example (where a large proportion of Black pupils live), there have been some of the biggest reductions in exclusions. However, in Outer London (an area which also has a large Black pupil population) there were actually small increases in the exclusion rate of Black pupils.
We also re-ran our analysis of the exclusion gap and left out Inner London (the area with the largest falls in Black pupils’ exclusion rates). When we did this, the exclusion rate gap between White and Black pupils still narrowed across the rest of the country. This shows that it’s unlikely to be regional differences in the use of exclusion that’s causing the national narrowing exclusion rate between Black and White pupils.
What did we learn?
We know that the gap in the rate of exclusions between Black pupils and their White classmates has existed for a long time – a situation that clearly needs to change. Exclusion is linked to young people’s vulnerability to becoming involved in violence, which is why we’re committed to understanding the gap in exclusion rates between pupils from different backgrounds. And while it’s good news that, in a highly unusual year, the gap between pupils from Black and White backgrounds almost closed, we still don’t have a full picture of why that is.
Our analysis did show us that changing demographics and regional differences in the use of exclusion might have played a very small part in closing the gap. But we still don’t know if this trend is to do with the way schools address issues of race and racism, factors related to the pandemic or something else. It’s a complicated problem and we need to do more work to understand it. That’s why, today, we’re launching funding for more secondary data analysis. We want to work with research partners to understand what’s driving changes like this, so that we can focus our work and keep young people safe from violence.
Our funding rounds will also extend our knowledge of what works to drive down exclusion. We’re committed to make sure that, through independent evaluation of the projects we fund through our A safe, positive place to learn and School choices grant rounds, we’re finding out if policies, programmes and approaches have the same benefits for all children – and don’t privilege some on the basis of race, gender or class.
By continuing to use data and investing in approaches that have a good chance of making a difference, together with our partners we’ll learn more about what works to address unfairness. That way, we can protect every child from involvement in violence.
To find out more about the funds we’ll use to make change in education, click here. And to find out how to apply to work with us on secondary data analysis, you can find out more here.
Related content
- Blog
Blog:Keeping young people safe at school and improving their life chances
Igraine Rhodes and Sarah Fullick explain why the YEF and EEF are coming together to learn how to improve school attendance and reduce exclusion. - Blog
Blog:Download our statistics update to find out about the latest crime trends
Find out what the most recent data tells us about the way crime and violence is affecting young people today -
Interventions to prevent school exclusion
Interventions which aim to prevent children becoming excluded or suspended from school.